Phase diagram
In chemistry, a phase diagram is a graphical representation that shows the conditions of temperature and pressure under which a substance exists in a particular physical state: solid, liquid, or gas.
It is essential for understanding phase transitions—such as melting, solidification, vaporization, or sublimation—and is widely used in various industrial fields.
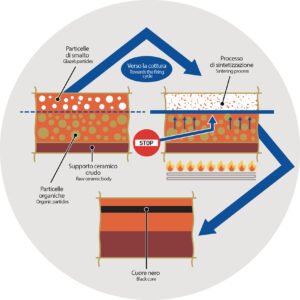
In ceramics, phase diagrams are employed to analyze the thermal behavior of material mixtures (such as clays, feldspars, quartz, and metal oxides) during firing.
They help identify, for example, the temperature at which a phase melts or a new solid phase forms—critical information for producing ceramics with the desired mechanical, aesthetic, and functional properties.
During ceramic firing, it is crucial to avoid the formation of unwanted phases or internal stresses caused by uncontrolled phase transitions. Phase diagrams enable the design of material formulations and firing cycles that lead to the development of stable, well-performing phases.